What are Candlesticks?
Please ensure you have watched the full video before moving onto the next section. You cannot mark complete until you have watched.
Candlesticks are one way of showing the movements in price during each time period on the trading charts. There are others, but we won’t go into them here because we only use candlesticks and there’s no real reason to use the other types.
A candlestick shows the Open, Close, High and Low prices of one time period. This could be a whole day, 4 hours, 1 hour, or 15 minutes; whatever time-frame you choose on the chart will be the period represented by the candle.
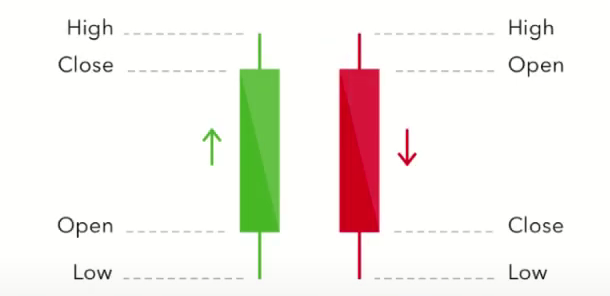
A green candle shows the price went up in that period (i.e the close price is higher than the open price), and a red candle shows the price went down in that period. You can customise these colours on your charts if you so wish.
Wicks are the thin line parts of the candlesticks. These show the difference between the High/Low and the Open/Close. Wicks can be used to give an indication of the buying or selling momentum during that candle’s time period.