Bollinger Bands
Bollinger band basics
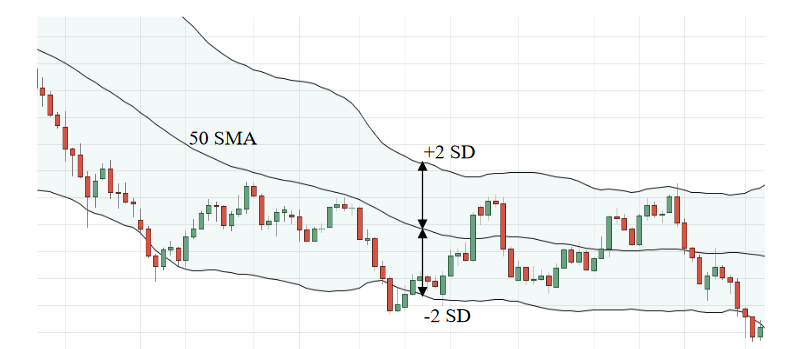
Bollinger bands create a price range based on standard deviations(SDs)away from the moving average. An example of this is shown below, where the Bollinger bands are drawn from a 50-day simple moving average (SMA) using 2 standard deviations. To draw Bollinger bands simply add/subtract the number of standard deviations required from the SMA.
Standard deviation fundamentals
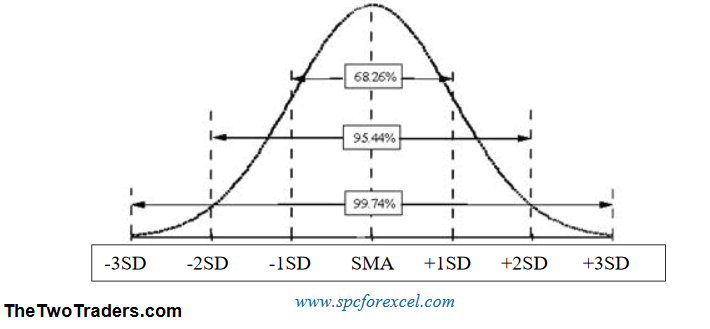
Standard deviation is simply how close the data tends to be toward the mean of a data set(or in this case the SMA). The data set in this example is 50 days as we are using a 50 day SMA. The chart below shows the distribution of a random set of data, as you can see most of the data will be close to the mean.
Now let’s think about this in terms of prices. We have 50 days of prices and we can assume these prices fit the normal distribution. That means if we set the Bollinger band to a distance of +/-1SD from the SMA, 68% of the price will remain within the band and 32% will remain outside the band. If we set this to +/-3SD from the SMA, 99.7% of the prices will be within the band and only 0.3% of the price will remain outside the band.
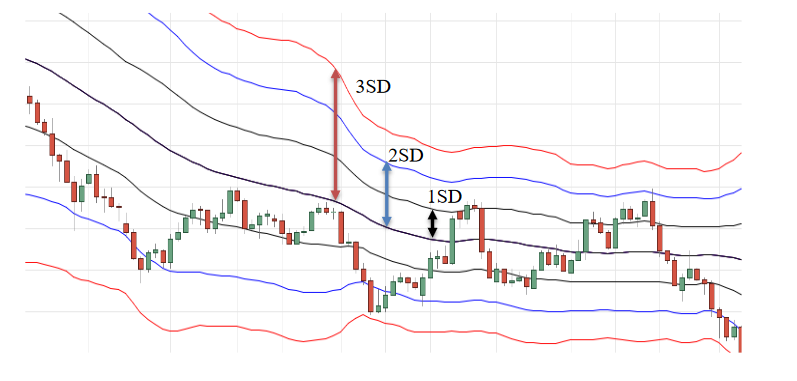
Now let’s lookat the effects this has on the charts:
1 SD -~48 prices out of the Bollinger band range.
2 SD -~8 prices out of the Bollinger band range.
3 SD -~ 0 prices out of the Bollinger band range.
How to use Bollinger bandsin systems trading
Bollinger bands are favoured by many in systems trading due to several reasons:
- Avoids entering trades in consolidation periods (as the price remains within the band).
- Accounts for market volatility due to the inclusion of SD in its calculation.
- Creates a point to enter a trade when the price breaks out of the band.
Entering a trade
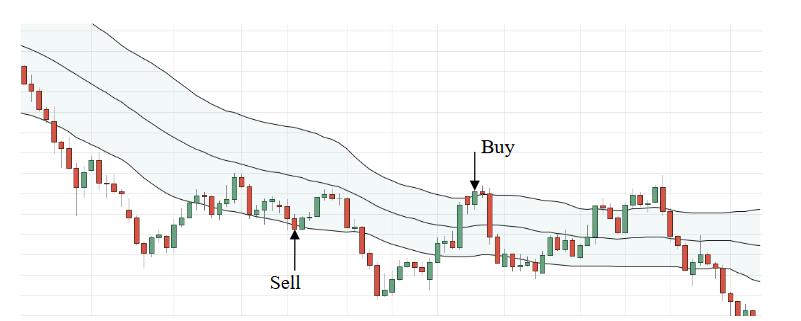
- Price break out
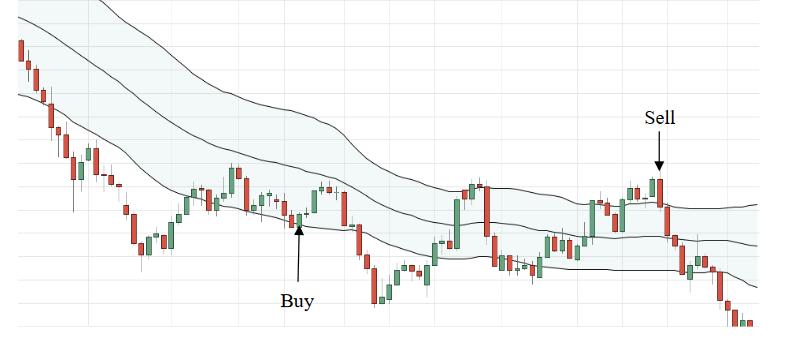
The simplest use of the Bollinger band involves entering a trade when the price breaks out of the Bollinger band. As you can see from the chart, a sell trade is entered when the price breaks below the band. A buy is entered when the price break above the band.
This break out tactic works well for trending markets, where price consistently remains outside the band.
2. Price break in
Another entry method using Bollinger band when the price breaks out and then back into the band. As you can see from the chart, a buy trade is entered when the price breaks below and then back in the band. As you can see from the chart, a sell trade is entered when the price breaks above and back in the band.
This break in tactic works well for consolidatory markets, where price remains within the band.
You can use a moving average filter to focus on only entering breakouts or break-ins in the direction of the overall trend. This significantly improves the profitability of a system. This is covered in detail in the Filters guide.
It is important to note that only the first breakout or break-in is entered in this instance. Once in a position, the market will often break back in the bands, then back out, and this may happen many times during a long move. These can be used as an opportunity to pyramid (enter an additional position), but it must be noted that later breakouts have a greater chance of being losing trades. For this reason, we prefer to only trade the first breakout.
Closing a trade
- Close on SMA
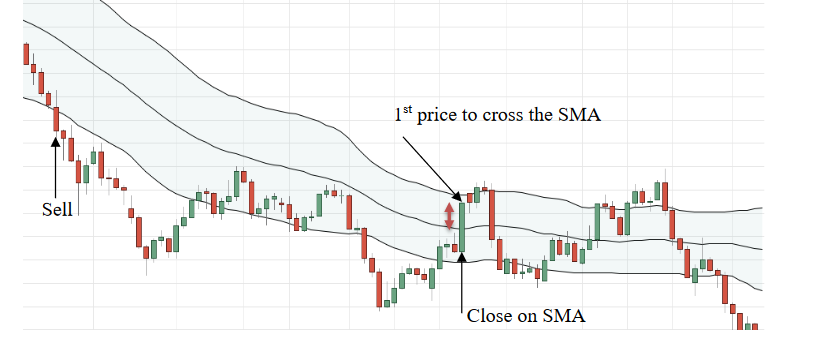
A potential exit method using Bollinger bands involves closing a trade when the price crosses above/below the SMA. Closing on an SMA works best for long term and “clean” trends.This system would work as follows:
- Enter a sell/buy trade when the price breaks below/above the Bollinger band.
2. Wait for the price to cross above/below the SMA for a sell/buy trade and exit that trade on this signal(or get stopped out).
2)Close on Bollinger band
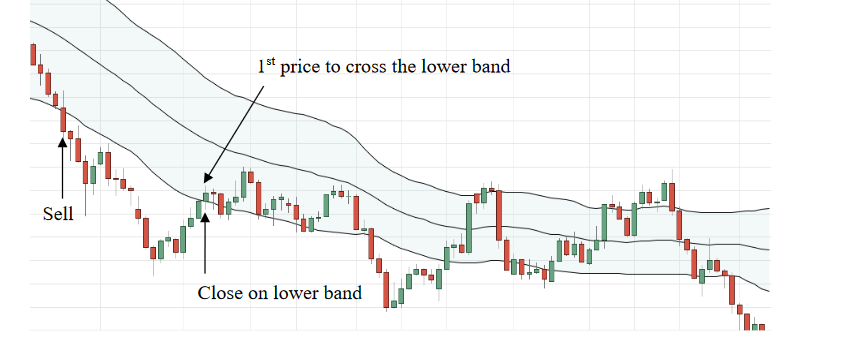
Another exit method using Bollinger bands involves closing a trade when the price crosses above/below the Bollinger band. Closing on a Bollinger band works better for short term and volatile trends.This system would work as follows:
1.Enter a sell/buy trade when the price breaks below/above the Bollinger band.
2.Wait for the price to cross above/below the lower/upper Bollinger band for a sell/buy trade and exit that trade on this signal.
Variation in Bollinger band length
The Bollinger bands are formed around a moving average which, as discussed in the moving average guide, can be varied to give considerably different trading styles. Below is an overlay for 3 different Bollinger band lengths: 20-day (black), 50-day (blue) and 200-day (red). The numbers on the graph represent a price breakout for that corresponding length.
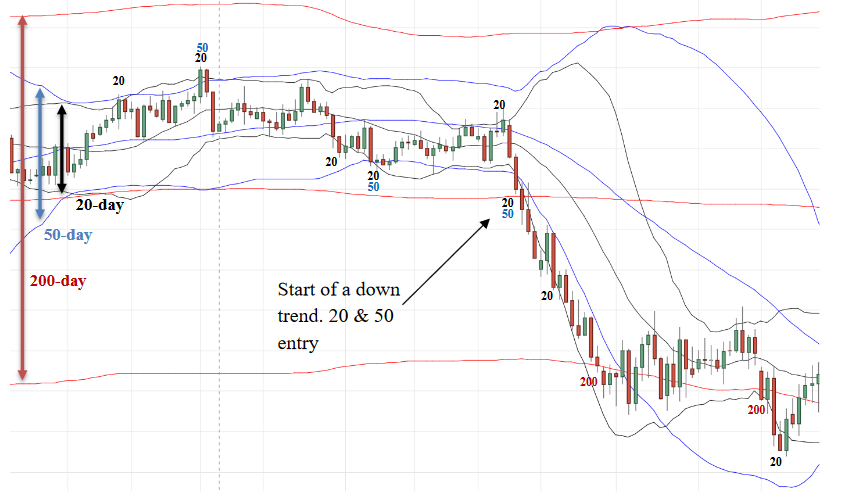
The number of positions entered during this period are as follows:
20:8 positions (1 big winner)
50:3 position (1 big winner)
200:2 positions (no big winners)
You can see immediately that the Bollinger band for the 200 is significantly wider than the 20 & 50. This means no positions are entered during the consolidation period in the first half of the chart, whereas the 20 is very reactive and enters false moves more frequently. The 50-day enters two false moves, but also captures the big downtrend on the same day as the 20-day, but holds for longer. The 200 does not enter any positions during the “big trend” until the move is already over, and so does not make any profit in this period.
It’s difficult to tell immediately which length is most effective, as each has its merits. However, from all of our testing (literally tens of thousands of trades) there was a clear winner: The 50 day.
- The 20 day gets in positions early, but this also results in a high number of false moves, which eats away at profits during consolidation.
- The 50 day has few false moves and is short enough that trends are caught early on.
- The 200 day is great at keeping you out of the market during consolidation but also keeps you out of new trends for a significant part of the move.
Summary
1)Bollinger bands can have varying moving average lengths, as well as various standard deviations widths.
2)The standard deviation represents the % of prices that are likely to remain within that range
3)Bollinger bands are great at avoiding losing positions during consolidation periods, and an excellent entry signal to signal the start of a move
4)Both breakouts and break-ins can be traded profitably
5)Short Bollinger band length results in earlier entry but many positions and a lower win rate. Very long lengths result in later entry and very few positions. A compromise is found in-between, with early entry without too many false moves.