Head and Shoulders
Head and Shoulders
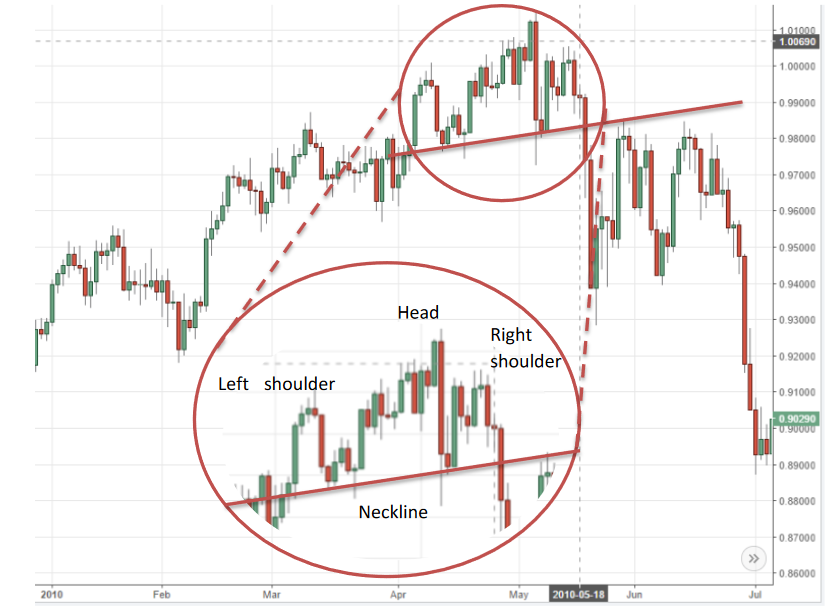
The head and shoulders pattern is another reversal pattern indicating a change in the prevailing major trend. The pattern is easy to spot and appears on all time frames. The pattern provides not only an entry point and stop loss, but also a target price. The pattern is made up of the following:
- Left shoulder: Price rises followed by a left peak, followed by a decline
- Head: The price rises again, making a new peak higher than the left shoulders peak, followed by a decline
- Right shoulder: The price rises again, but is unable to rise as high as the head. The support level is known as the ‘neckline’ (in keeping with the heads and shoulders analogy)The example below is for AUDCHF in 2010.
As with all these patterns, it works in both directions. The inverse head and shoulders is the same, but a mirror image in the horizontal direction.
Left shoulder: Price falls followed by a left peak, followed by a rise
Head: The price falls again, making a new peak lower than the left shoulder, followed by a rise.
Right shoulder: The price falls again, but is unable to fall as low as the head.
Another example is shown below for CADJPY in 2016. The patterns are never perfect, and there will always be slight variations. It is clearer to see when some of the noise is taken out of the market. The green triangles represent the left shoulder, head, and right shoulder and are formed by joining the low of the period to the neckline.
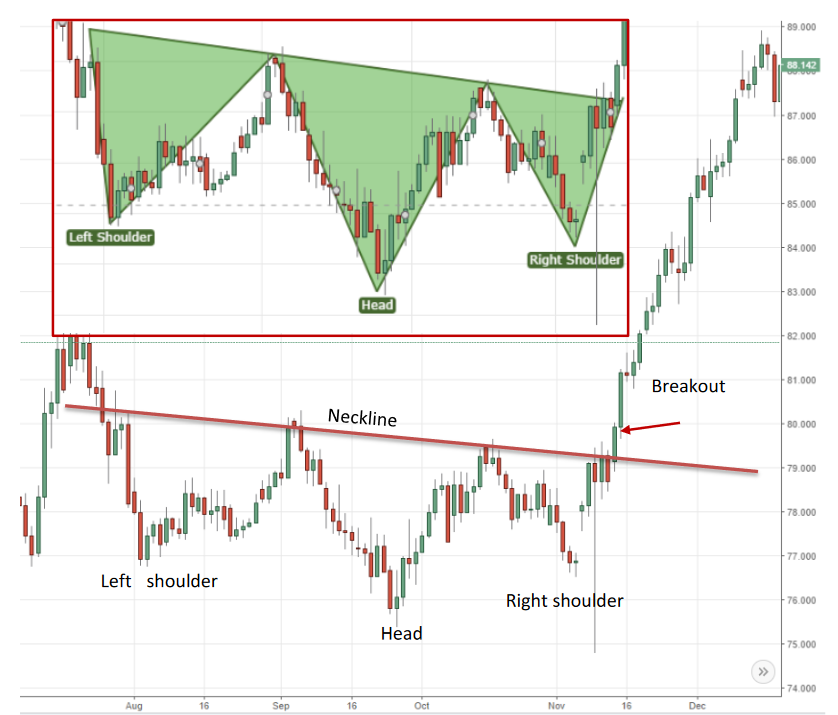
You can spot the pattern forming when the left shoulder and head are developed, and the market begins to rally away from the neckline. If it fails to make a higher high or lower low than the head, the right shoulder has formed. In a ‘classic’ head and shoulders, the right shoulder is approximately the same size and length as the left shoulder, but this is not always the case. Provided the peak does not exceed that of the head, it is still a valid pattern.
How to trade the pattern
It is crucial you wait for the pattern to be completed. You cannot assume the pattern will become complete simply after the left shoulder and head have formed. This will drastically increase the number of false moves you are caught in and cause you unnecessary losses.
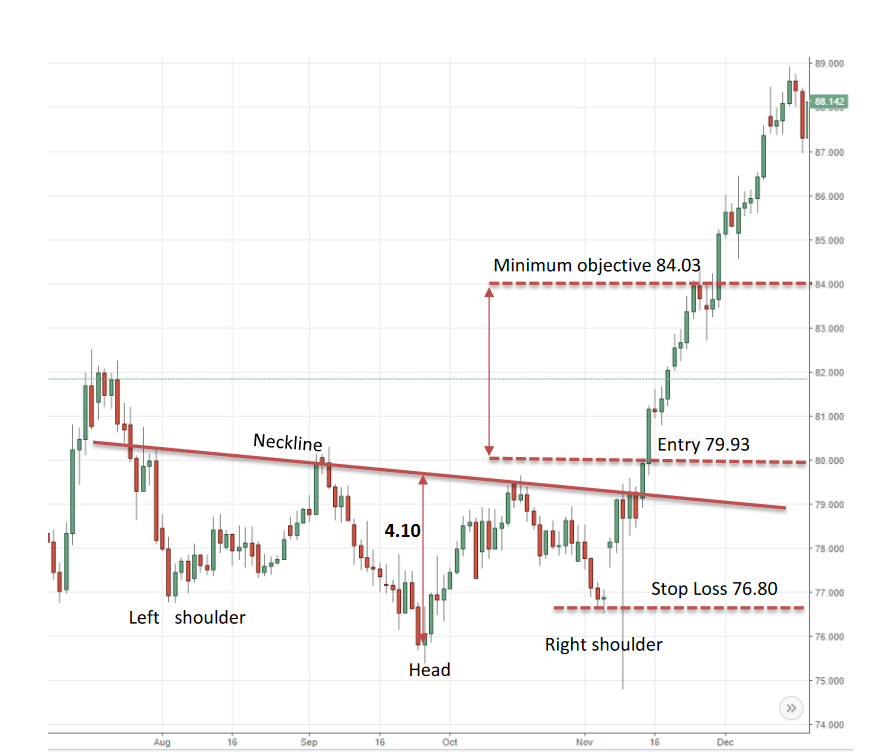
Once the price breaks the neckline a position can be entered in the direction of the breakout. Often the market will retrace back to the neckline giving an excellent opportunity to enter with a low-risk position. If the market retraces past the high of the right shoulder, the pattern is no longer valid and positions should be closed. A common place to position the stop loss is just above/below the right shoulder (Above for a sell, below for a buy). This allows for some retracement and volatility and will prevent you getting stopped out of the best moves.
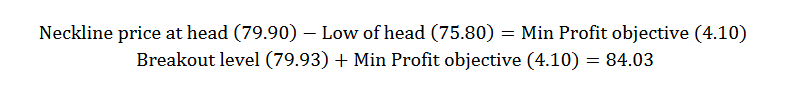
Another bonus with Head and Shoulder patterns is that they also provide a target for how far you can expect the breakout to move. If you measure the distance from the neckline to the peak of the head, then you can use this distance as a minimum objective for the subsequent breakout. This will ensure you do not exit prematurely and your risk/reward is good enough.
Using the example for CADJPY above we can see that the market surpasses the minimum profit objective.
The minimum profit objective can be calculated as:
The market actually moves all the way to 89, giving a risk to reward of about 3:1 for this move. This process is outlined in the chart below.
Below are some rules for trading the head and shoulders pattern, adapted from Trading commodities and financial futures by George Kleinman. A great starting point for technical analysis and well worth the read.
- Never anticipate the pattern: Wait until it is complete and the price breaks the neckline before entering.
2) The larger the pattern and the longer it takes to develop, the bigger the subsequent move.
3) The distance between the neckline and head is the minimum move you should expect after the breakout. However, this is of course not a certainty, so if the market moves very close to this level then starts turning back, use some judgement.
4) Watch the slope of the neckline. Downward sloping necklines increase the odds for more powerful breakdowns for normal head and shoulders, and upward slanting necklines increase the odds of powerful breakups for inverted head and shoulders.
5)Check the volume. The most reliable breakouts occur on high volume.
6) The market shouldn’t really retrace beyond the neckline. These patterns are reliable, so if they don’t act correctly, get out of the position.
7) If the signal is false, look for an opportunity to reverse. Often if the head and shoulders fails, it may be a signal that the move is not over. A consolidation or pennant pattern may follow, which can be traded as discussed in the respective guides.