Loss Aversion
Loss Aversion
The difference between profitable traders and losing traders is the ability to handle the emotions associated with realising a loss. The main issue here is most of us are raised to believe losing is to be something that should be avoided. As such, all too often a rookie trader will decide to hold a losing position in the hope that it will come back to profit, with no clear exit strategy. Often the market will move much further away from their entry such that the rookie trader regularly extends the stop loss associated with the position. This makes it increasingly difficult to close the position at the newly extended stop at much larger loss than when the position was first created, until eventually the rookie has blown their account.
With trading, you must accept that you are likely be wrong more than you are right. The key, however, is making sure you make more money when you are right thanlose when you are wrong.
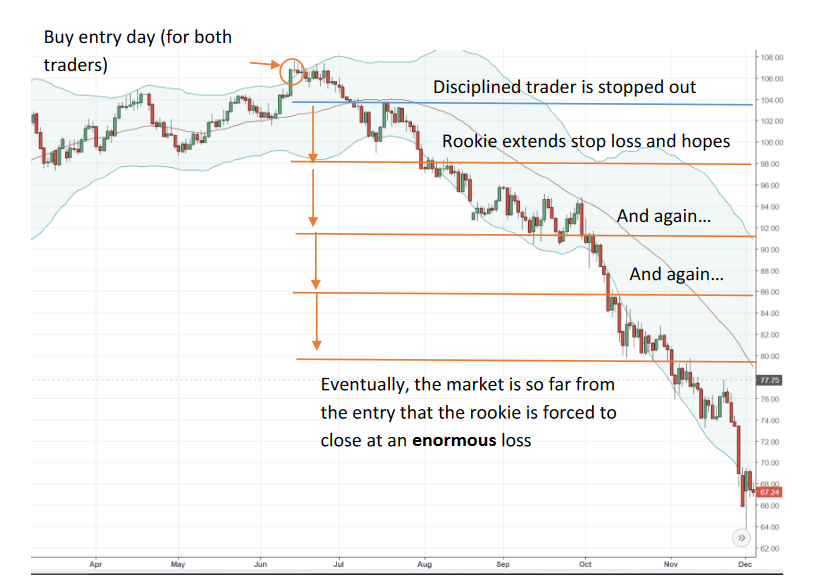
Let’s give a quick example of how thisworksin action for a losing position. Imagine you bought oil on the breakout at $107 in May 2014. As you can seefrom the chart on the next page, the market quickly begins to turn back down, showing a loss on the position.
Disciplined trader: Now, for a disciplined trader this should be no issue. The trader will have placed a stop loss, and this should not be extended. As such, the position will be stopped out and closed at the pre-determined loss amount and the trader moves on.
Rookie trader: On the other hand, the rookie doesn’t want to take a small loss because he wrongly believes being profitable is about having ‘winning’ trades. As such, he extends his stop loss and hopes the market turns back. When the market goes further, it is now even more difficult to take the loss as it is now twice as big, As such, he extends his stop-loss even further and hopes the market turns back around. It is now EVEN HARDER to take the loss. At this point, the trader is overwhelmed with fear and anxiety and gives himself no choice but to extend his stop-loss even further. Eventually, the market is so far from the entry that the rookie has run out of money to fuel his losing position, and has literally wiped his account in a single move.
You might believe that you would never do this, but if you don’t have a clear exit strategy and the discipline to follow it, it is all too easy to take this dangerous path. I have seen traders with their stop losses at -1000% or higher, just to fuel a losing position. This is ridiculous and almost always ends in a catastrophic failure.
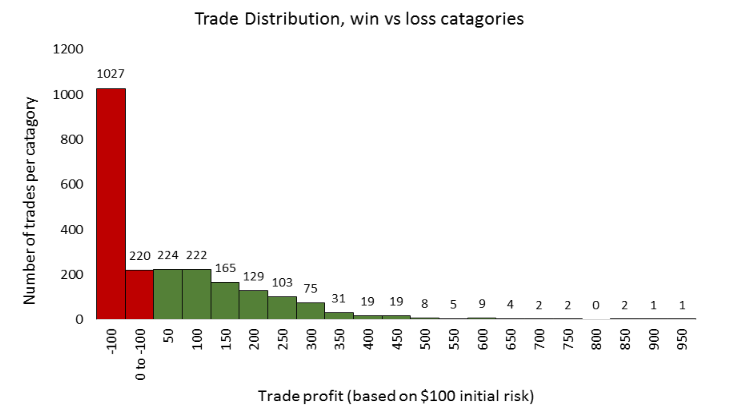
The example above should demonstrate clearly how essential it is to limit your losses and cut losing positions quickly. To emphasis this point, the histograms below show the trade distribution for an 80% annual compounded growth rate system we tested for 2283 trades. The win % for this system was 45% over the tested period. You can see how essential it is to be able to handle losing trades, as trades being stopped out represent nearly half of all trades entered.
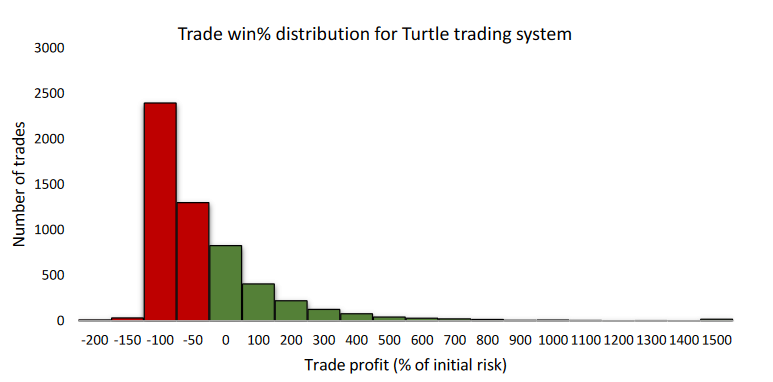
To show that this isn’t the result of a poorly designed system, the same distribution is shown before for Richard Dennis’s turtle system which made him hundreds of millions of dollars. (This data was taken directly from the book ‘the way of the turtle’, which I highly recommend you read). You can see there’s still the same distribution of trades. In fact, the win% for this system is about 35% as there is a larger number of huge winners (1500% +)
These histograms emphasise the importance of being able to handle losing trades and to make sure that the losing trades are capped at that -100 level. (The trades below -100 are where the market has gapped below the stop loss level. Note how few there are relative to the total number of trades).
If you can think in terms of this probability it makes it much easier to handle losing trades and accept that this is a necessary part of trading. However, although this is psychologically difficult to handle the rewards are great. The distribution below shows how these positions convert into raw profit: this assumes every trade risked £100, regardless of account size.
The previous histograms, showing the number of trades, could appear to be a losing system. However, when this exact same data is weighted based on the actual value (so one-100% trade= -100, but one+500% trade = +500) the picture is very different. Since the average revenue gained per win is significantly bigger than the average revenue per loss, these frequent losses are made to look insignificant.
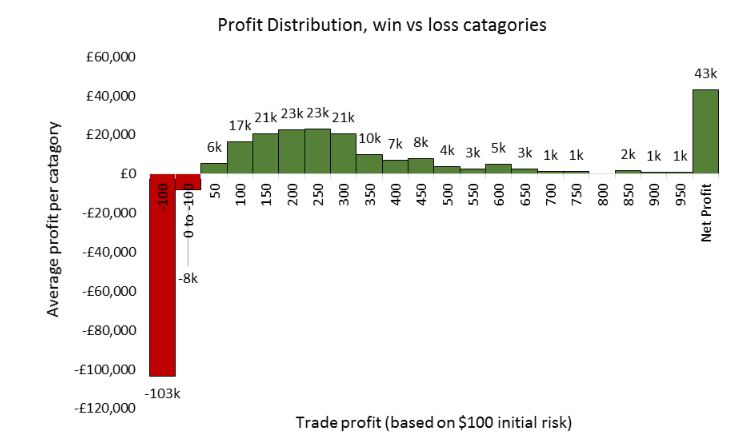
The net profit for the E&J system, without position scaling (see money management guide for position scaling), is over £40,000. This shows the power of limiting losses early on with stop losses and is the reason you should never ever extend your stop loss. Imagine extending your stop loss and seeing trades appear on this histogram in the -$1,000 or -$1,500 region, this would undoubtedly end the profitability of any system.
Loss aversion is going to be a natural feeling when you start trading. By looking back at these histograms and using the exit strategies we have showed you in previous guides, you should be able to resist the urge to extend your stop losses and hope the market will turn around. Trust me, taking a loss may never feel great, but it is infinitely better than the stress and fear that comes with watching a losing position spiral out of control: it only takes one to wipe your account and ruin your trading dreams.