Overview of Technical Analysis
There are two macro-methods to analyse, the markets: technical analysis and fundamental analysis. Fundamental analysis is essentially the study of supply and demand, whereas technical analysis is concerned only with price action.
Although fundamentals are ultimately what moves price, it is virtually impossible for most of us to know all the fundamentals that affect the price at any given time. By the time the news reaches most of us, so many other people know about it that it is already factored in the price, and so there is no money to be made.
How does it work?
1)There are four key reasons why technical analysis works: ‘Footprints in the Sand’: The smart money (who tend to be the big players such as banks, hedge funds and governments) cannot hide their movement. They might be better informed, but their buying or selling is directly reflected by the price (After all, price is simply a function of buying and selling interest at any given time). This means that using technical analysis you will often enter a position before the fundamentals become obvious to regular traders.
2) The market discounts all fundamentals in the price: meaning supply and demand will be reflected by the price eventually.
3)‘History does not repeat itself, but it does rhyme’–Mark Twain. He may not have been a trader, but Mark Twain hit the nail on the head here. Although price action will never repeat itself exactly, it does follow very similar patterns.
4)Markets move in trends, which are more likely to continue than not.
‘Footprints in the sand’
Understanding the governing patterns in technical analysis trading can be a great asset in either systems testing or when actually trading for profit on the live markets. If you are able to use these patterns to enter before everyone else notices in the market then you will have an edge over the competition. Common patterns to look out for include support/resistance, double tops/bottoms, flags, rectangles, pennants, symmetric triangle and head and shoulders to name a few. Do some research on these patterns and get to know them in the market, try and spot them before they happen.
Future guides will describe these patterns a lot better,but here are a few examples to provide you with the confidence that technical analysis and pattern spotting does in fact work and repeats itself time and time again:
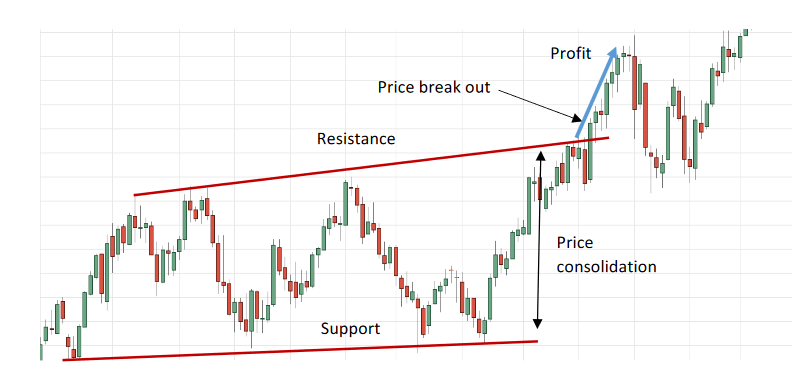
Support and Resistance
Support and resistance levels are simply historic price points where the price tends not to exceed this level. As you can see here the price breaks out of the resistance line after months of consolidating (a price range). As a trader, you want to buy at the initial break out point, so you can position yourself before everyone else begins to buy and fuels the move. In this case, a small profit could be taken as more and more traders realise the price has exceeded the normal level, whilst you have been sitting in this trade for days making a nice profit. Trading with support and resistance is covered in much more detail in our ‘support and resistance’guide.
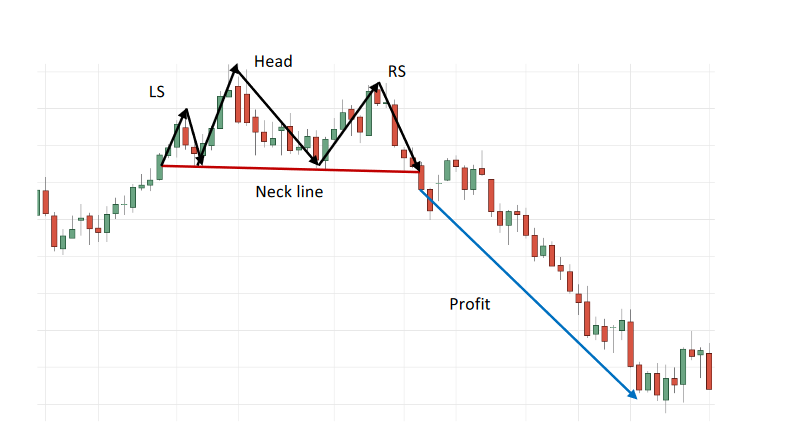
Head and shoulders
Head and shoulders is another chart pattern to recognise. Although slightly more complicated than support/resistance it is a very clear pattern to see when it does occur. It is very clear because, as you can see in the chart, there is a key support line (neck line) and two smaller peaks either side of one larger peak. The two smaller peaks are known as the left and right shoulder (LS & RS) and the large peak is known as the head.
Another rule of thumb with head and shoulders patterns is that the profit gained is usually a similar size to the neckline, which can be seen in the example below. Make sure to study this pattern and spot it in the charts. Check out our‘head and shoulders’ guide for more detail.
To receive the market edge using this pattern you would place a sell trade on the first red candlestick, but only after the LS, head and RS had formed. Then hold this position until the approximate length of the neckline in the vertical direction.
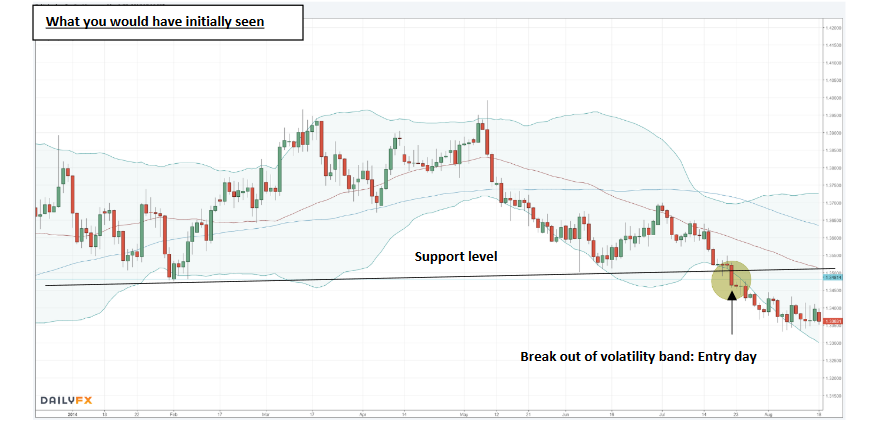
Real Example Trade
We will go through technical analysis in much more detail in subsequent guides, but the example trade below on EURUSD from 2014 using one of our systems shows the power of technical analysis. You could have traded this, with absolutely no understanding for why the market was moving and got a risk/reward of 1:43! That is $20,000 for a $500 risk position, using the EXACT rules we teach. Don’t worry if some of the indicators don’t look familiar, these are explained thoroughly in later guides and videos. If you still don’t understand, feel free to ask us!
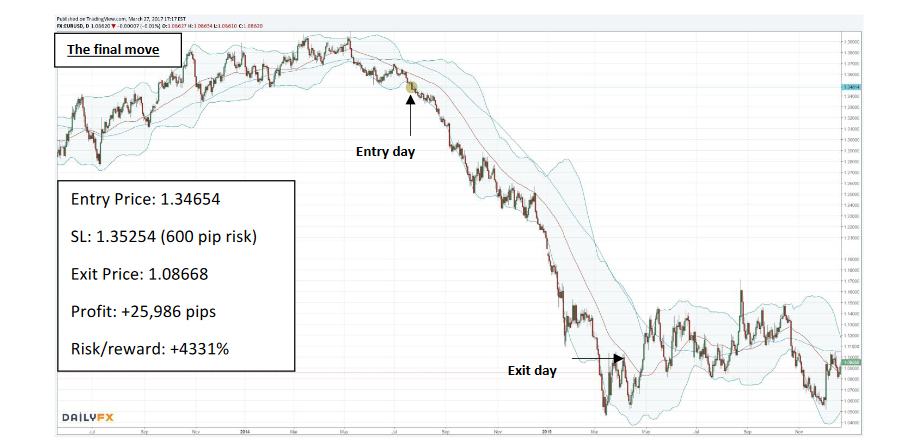
Although moves like this are uncommon, they do occur, and this is what we are looking to capture. A single trade like this can make your year, and when you can easily track 30+ markets you greatly increase your chances of catching one.
The important part of trading is how you properly manage a trade like this. Once you have a set of defined rules in place (which we will teach you), it is much easier to overcome urges such as the temptation to close out a profit too early (imagine how many people closed this position out at less than 100% profit and missed out on a fortune!)
Real ‘Rags to Riches’ using technical analysis
The truth of the matter is that there are people who have turned small amounts of money into large fortunes using the principles of technical analysis. Below are some real examples you can look up:
- Richard Dennis: $1,600 to $200,000,000 10 years
- Michael Marcus: $30,000 to $80,000,000
- Jessie Livermore: $2,500 to $100,000,000 30 years
- Ed Seykota: $5,000 to $15,000,000 12 years
- Bruce Kovner is worth more than $4.1 billion
- John W. Henry is worth $840 million
- David Harding is now worth more than $690 million