Price Shocks & Pyramiding
Position Scaling
This system could generate a profit of $43,000 over a period of 15 years. I think you can agree that this is not life-changing or worth committing a significant amount of time to. This is where position scaling comes into fruition. Position scaling enables your profits to move from the thousands to the millions.
Position scaling means using your portfolio as a dynamic indicator of the amount of money you can risk. For this example, let’s use a slightly higher risk level of 2%. As explained, a larger position size % gives a slightly higher drawdown but also increase the CAGR (compounded annual growth rate) of the system. Your position size must always remain a fixed percent of your total portfolio value for every trade. If you choose a risk level of 2% per trade, this rule must be applied to every single trade (I/e, don’t risk 5% on 1 trade, 1% on another etc.)
For example, let’s say your initial account size on day number 1 of your trading career is $10,000, therefore at 2% risk the amount you risk per trade is $200. Now let’s assume some of the trades you are currently in make profit and you make $1,000 in a day. Therefore, any new trades you place on day number 2 must have a risk value of 2% of $11,000. Your new risk per trade is $220. To ensure you scale your position effectively you need to update your equity each day and recalculate your risk per trade. Luckily, you can do this easily in our Trade Tracker we provide you, but be sure to update the equity value every day you make a trade.
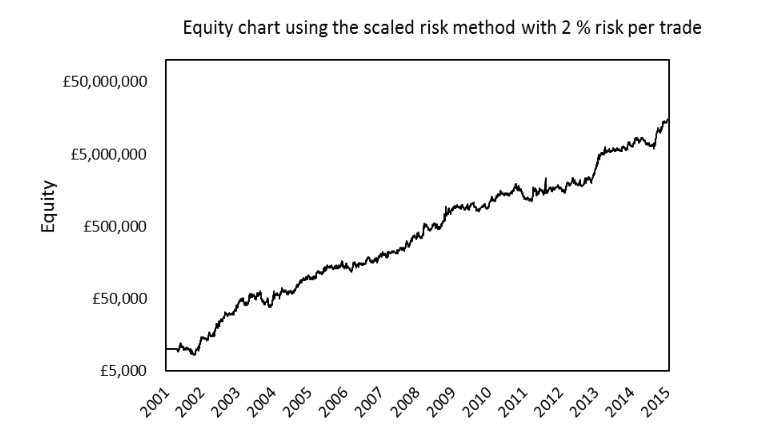
The graph below allows you to visualise the difference between having fixed risk amounts and using position scaling. For an unscaled system, we can assume that the final profit would be $86,000, as we are using a constant risk per trade of $200 as opposed to $100 in the previous example. Scaling the position size with a 2% risk per trade produces a final profit of $15,000,000. This confirms the power of position scaling.
Price Shocks
Price shocks are rare events due to a sudden change in supply and demand. Often ignored by many traders as abnormalities in trading and something one should not worry about. However, these price shocks can completely wipe out your account if you are using a position size which is too high. We do not ignore these rare events and understand that our position size needs to account for sudden price shocks.
Price shocks are dangerous on weekends, market holidays and contract rollovers/expiries. Just because the market is closed, does not mean the price will remain the same over the weekend or holiday. If a big event happens on the weekend the price can gap up or down (see gap guide). Your stop losses are next to useless over the weekend and will not close your position at your predetermined stop-loss price. Therefore, your exposure is larger than 2%, or whatever you’ve chosen to be your risk per trade.
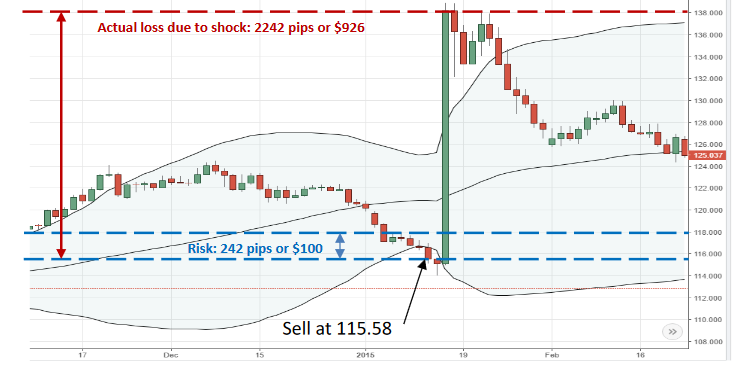
The chart below illustrates this problem. This is the chart for CHFJPY, with a big price shock on the 15/01/2015 resulting from the unpinning of the Swiss Franc from the EUR. Although this did not occur over the weekend, because the price moved so fast at the time, there was significant slippage (the difference in price between your stop loss and you’re actual closeout price). We can therefore use it as an example. Let’s say you entered a sell trade on the Bollinger break out at a price of 115.58 and you set a stop loss at 118.00 with a $100 risk. This is a pip risk of 242 pips, or $0.41 per pip. The price shock then happens two days into the trade and your stop-loss is missed (assuming it’s a weekend). The price is suddenly at 138.00 TheTwoTraders.comor a 2242 pip loss. This equates to a loss of $926.This is 9.3 times bigger than your initial stop loss which completely ruins your risk to reward edge.
However, as these events are rare, especially over the weekend, to counteract price shocks our systems are initially designed to have a maximum drawdown of 50%. As mentioned at the start of the money management guide, position size is the easiest method to control drawdown size and reduce risk associated with price shocks. More recent examples of price shocks include Brexit and Donald Trump winning the US Election.
In addition, market diversity comes into to play here. This example was common for all CHF currency pairs.Imagine a system which included5 currency pairs all with CHF as part of the pair. If each pair also lost $926 you would lose $4,630 in a single day. Next assume your account size is $10,000, this is an almost instant 50% drawdown. Therefore limiting the number of currencies in your portfolio to a maximum of 2-3 can prevent youraccount being destroyed in a single day.
On the flip side, price shocks can also work in your favour, if you are positioned in the same direction, and can result in a huge profit in a short period. Since price shocks are, by definition, unpredictable events, do not let their existence deter you from trading. Provided you have good money management, through position sizing and diversification, you should live to trade another day and these may actually present opportunities. For example, during the US election we were positioned on the wrong side of the price shock. However, as we traded the price action during the market panic, we actually made 40% on our account in a single day (instead of losing 20%).
Pyramiding
Pyramiding is essentially the technique of adding more positions as the market moves in your favour. Each position subsequently added has less risk than the initial position when you first entered the trade. This is best explained using examples so let’s look at the charts.
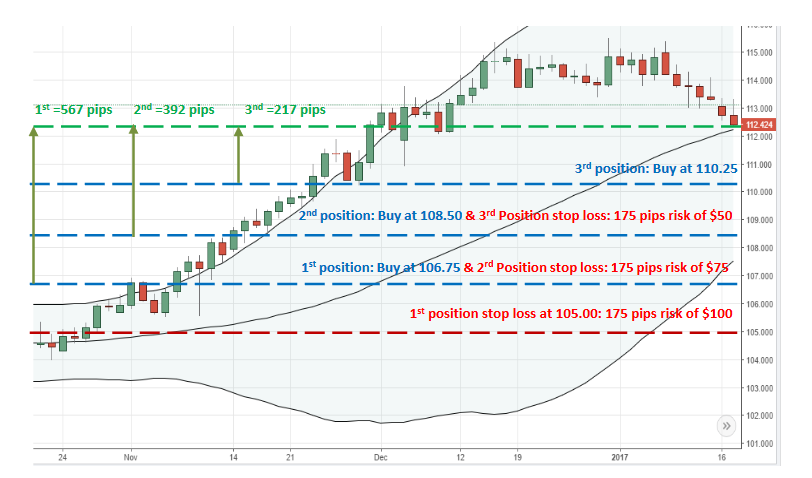
Let’s assume this system has a maximum number of 3 available pyramids, and each pyramid level (new position) is added after a single stop-loss width i.e. the price width between the entry price and the stop loss. The initial position is $100 of risk, the second position is $75 of risk and the final position is $50 of risk, hence you are pyramiding the position size. Once the profit exceeds a stop loss width you enter a new position, position number 2. You then move the stop loss of position 1 to the entry price of position 1, therefore removing any risk you had in position 1.Let’s break this down using the chart example below:
1.Enter a buy position on the Bollinger break out at a price of 106.75 with a $100 risk. You set the stop loss at 105.00 giving you a value of $0.57 per pip of your position. Note that because you set your stop loss at 105.00 your stop-loss width is 1.75. As you are pyramiding after a stop-loss width your next pyramid point is 106.75 + 1.75 = 108.50. Your first position should be at +100% profit at this level.
2.The price then exceeds the 108.50 mark and you add your second position with a $75 risk. The stop loss width is the same giving you a stop loss for position number 2 which is the same as the entry price for position number 1, 106.75. This gives you a per pip value for position number 2 of $0.43 per pip. However, you are now exposed by $175 due to the two positions, position 1 & 2. To counteract this, you would move the stop loss of the first position to the entry price of the first position, so move it from 105.00 to 106.75. This would move the risk on your first position from $100 to $0. This is the advantage of pyramiding because now you have 75% of the initial risk and one position already in profit with a second position looking to further to profit per pip.
3.This process is then repeated for the third and final position. The third position will be entered at 110.25 with a stop loss of 108.50 and a risk for this position of 50$. This gives a per pip value of $0.29 per pip. The stop loss of position one and two is then moved to the entry price of position two (or the stop loss of position three) which removes any risk associated with both positions one and two. Once the third position is added you have half the initial risk and have already made a profit from the first and second position. All this is illustrated in the graph below.
There are however disadvantages to pyramiding. The first being that each new position you add increases your average price. If you take the previous example your weighted average price by the time you enter the third position becomes:
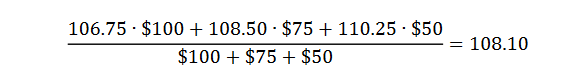
This means the price you enter, on average, is worse than simply entering the initial position, at a price of 106.75, with a larger risk. Furthermore, as you are moving your stop loss each time, you run the risk of being stopped out of all your positions and missing the move entirely.
Pyramiding also locks up more of the capital in your portfolio because you have to purchase three positions at a lower average price. The lower average price means you need more capital to produce the same amount of profits. This can be explained with a simple example. For the pyramid example above, you would have made $554 in total from all three positions and to do this you would have used $225 of your portfolio. If you wanted to only use a single position you would only need to $171 to produce the same profit of $554.By not pyramiding you free $54 of your capital to make a profit in other markets you invest in. This is the main reason we do not personally use pyramiding in our systems.
Instead, we use correlated markets to produce the same effect. For example, we trade both EURUSD and EURGBP markets. They are both based on the EUR, and so follow very similar (but not exactly the same, due to differences between GBP and USD movement) price action. For any significant trend in the Euro, we will receive an exit signal in both EURUSD and EURGBP markets. They may not be on the same day, but the most significant moves will produce signals in both markets. As such we are effectively pyramiding (adding a position on the same market for the same trend), but have the benefit of not having to adjust our stop losses, and also some market diversity associated with the variations between GBP and USD price movements.