Range Finder – Donchian Channels
Donchian Channel
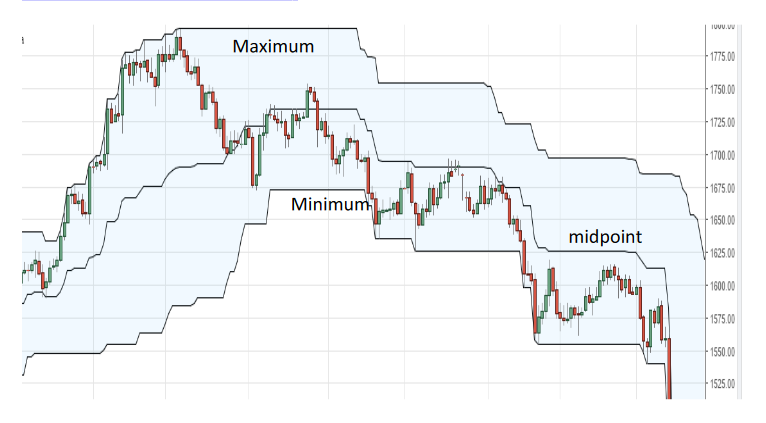
Donchian channels create a price range which is drawn from the maximum highs and minimum lows of a given time frame. An example of this is shown below where the maximums and minimums are updated every 50 days, or when a new high or low is made. A midpoint line is also shown, which is simply the middle point between the minimum and maximum highs and lows of the current day.
How to use Donchian Channels in systems trading
Donchian are favoured by many in systems trading due to several reasons:
•Avoids entering trades in consolidation periods (as the price remains within the channel).
•Creates a point to enter a trade when new minimum and maximum prices are made.
•Can also be used to create a point to exit trades.
Entering a trade
A very simple technique using Donchian channels is to use a new minimum or maximum to enter either a buy or sell positions. As you can see from the chart, a buy trade is entered when a new maximum is made by a new high in the price. A sell trade is entered when a new minimum is made by a new low in the price.
This technique is used to signal to the trader when a consolidation period is over and a trend is about to begin.
Let’s use a quick example system to explain this:
- Enter a Sell on a new price minimum and a Buyon a new price maximum. Also, you cannot open multiple sells or buy positions to ensure you hold the best average price.
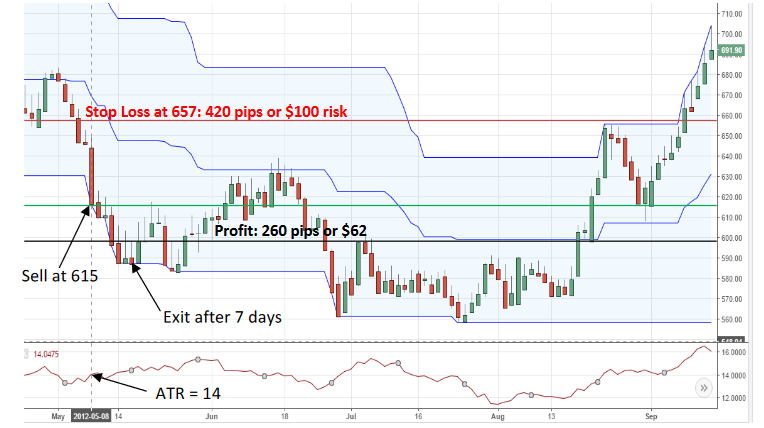
•As the example below shows, a sell position would be opened at 615 where a new minimum is made by the price.
2.Place a stop loss at 3 Average true ranges (ATR’s)of the day or purchase or sale.
•Stop loss placed 3 ATR’s above the entry price (see stop loss and ATR guides). The stop loss is therefore:

•As an example, let’s say you risk $100 on this position and due to the ATR, the stop loss is 420 pips wide. This is a per pip risk of $0.24.
3.Exit the position on a time-basedexit after 7days.
•After 7 days to price moves down to 589, a profit gained of $62.
4.Repeat this process for any new highs or lows made after these 7 days or if you are stopped out before the 7 day exit.
This is a very simple example of how to use Donchian channels to enter a position. You can use a variety of different stop loss techniques and exit strategies to optimise your system.
Closing a trade
The midpoint of a Donchian channel can be used to exit an opened trade. A trade is closed from a sell trade when the price closes back above theDonchian channel midpoint. A trade is closed from a buy trade when the price closes back below the Donchian channel midpoint.
This is shown in the example below:
1.Enter a Sellon a new price minimum and a Buyon a new price maximum. Also, you cannot open multiple sells or buy positions to ensure you hold the best average price.
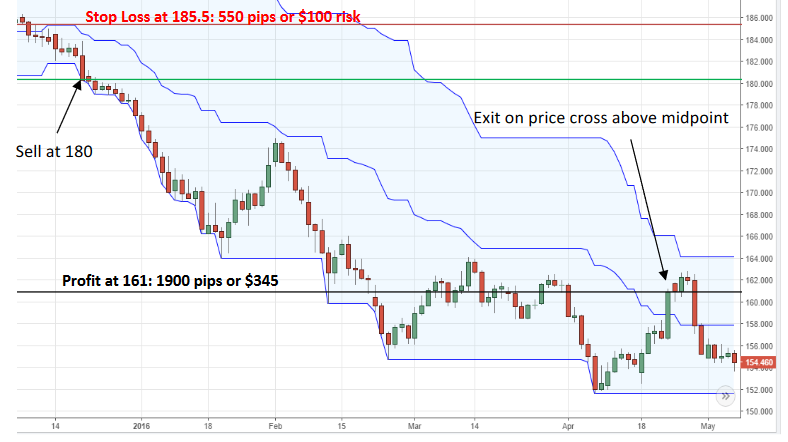
•As the example below shows, a sell position would be opened at 180 where a new minimum is made by the price.
2.Place a stop loss at the Donchian midpoint at the day of entry.
•At the time of entry, the stop loss is 185.5. As an example, let’s say you risk $100 on this position, the stop loss is 550 pips wide. This is a per pip risk of $0.18.
3.Exit the position when the price crosses above the midpoint for a Selland when the price crosses below the midpoint for a Buy, indicating the trend has ended.
•The price eventually crosses back above the midpoint and closes at 161.
•The price has moved down by 1900 pips from the initial sell point. Based on a per pip gain of $0.18, you receive $345 on your initial investment of $100.
4.Repeat this process for any new highs or lows made after the time of closure. Either by closure due to stop loss or by midpoint cross.
Variation in Donchian Length
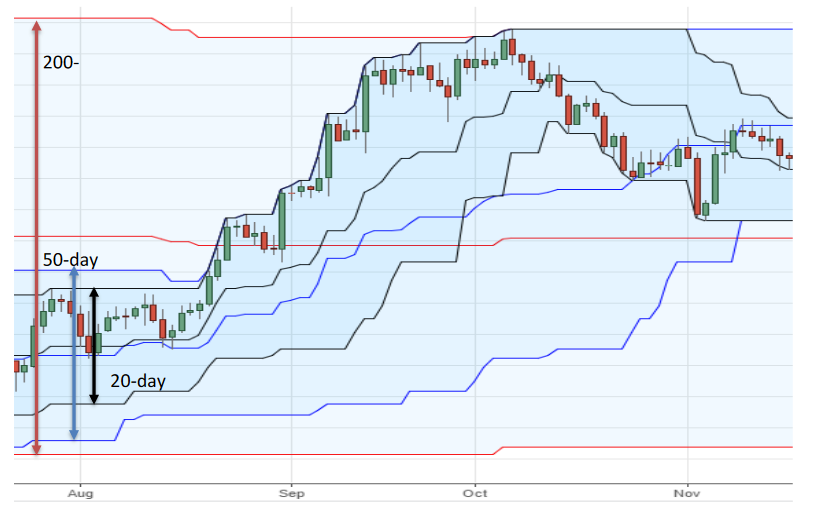
To change the length of the Donchian, simply alter the number of days the minimums and maximums are based on. Below is an overlay for 3 different Donchian lengths: 20-day (black), 50-day (blue) and 200 day (red).
As you can see the 20-day is a lot more reactive to price change. This is because the maximums and minimums are updated every 20-days, irrespective of whether a new min or max is made by the price. Therefore,it is based on recent price data which causes the Donchian channels to react much quicker. On the other hand, the 200-day is the slowest to react. This is because the max and min are updated every 200-days, irrespective of whether a new min or max is made by the price. Therefore, prices are “remembered” for 200 days which may be vastly different from the price action of the current day. This is clearly shown below, as the 200 max and min line is either much higher or lower than the current price of the day, unlike the 20-day Donchian.
Summary
•Donchian channels indicate when the price is making new maximums or minimums in a given time period.
•Donchian channels can be excellent indicators to both enter and exit a trade.
•Varying the Donchian time period can have a dramatic effect on the characteristics of the Donchian channel.