Spotting Volatility: Average True Range
What is ATR?
The Average True Range (ATR) is a volatility indicator. The ATR is the average of the ‘True Range’ over a selected period.
How to calculate ATR:
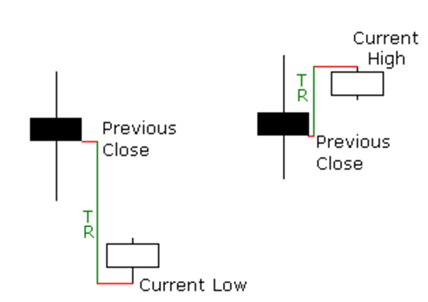
The ‘True Range’ is defined as the maximum value of the following three:
- The current high minus the current low
- The current high minus the previous close
- The current low minus the previous close
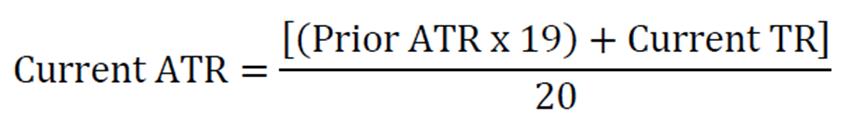
Once the ‘True Range’ is known, the Average True Range can be calculated from the following formula, if using a 20 time period indicator:
Why is ATR useful?
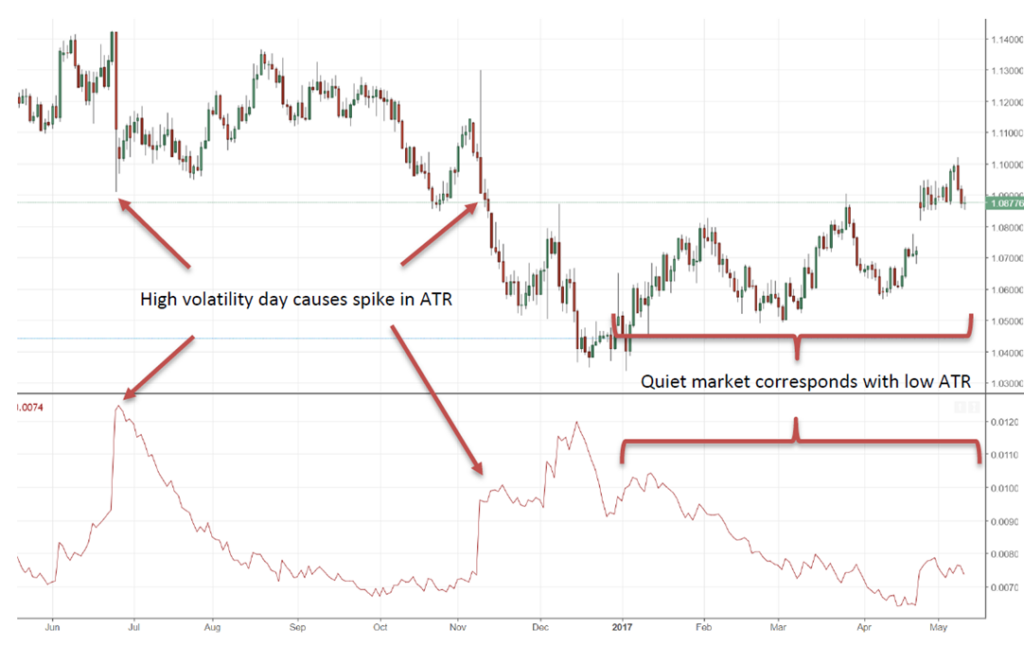
Average True Range gives an indication of the volatility of the market. We use it in our swing trading system to aid stop loss placement. In quieter markets the value of ATR will be lower and you will have a tighter stop loss, resulting in a better risk-to-reward. In more volatile markets the ATR is larger and your stop will be wider, therefore reducing the risk of being stopped out prematurely. This system is explained in detail later in the course.
Chart Example: