Money Management
Money Management
Money management is a method taken from gambling theory and it is a strategy used to reduce the risk of losing all your money whilst maximising your profits. This is accomplished in trading by assessing the number of markets you are trading, their dependence on one another and the amount invested into each market. Money management is especially important in drawdown periods, which are inevitable in any trading system, where your account loses money before making new highs.
Therefore, money management is a decision you make about finding the best point between what you are happy to risk and the profit you are happy to leave on the table. Money management is more personal than many realise. You need to sit back and ask yourself the question, “am I able to carry on trading when I am down X%”.
The principles governing money management
This section of the guide will highlight the main principles that influence your money management strategy and in turn determine your likely drawdown and profit potential.
1.Position size, or % risk per trade.
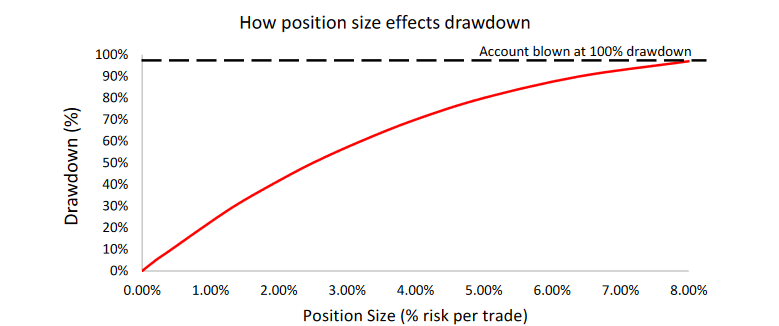
The chart below is based on the historical backtesting of one of our trend following trading system. It illustrates the effects of changing your position size, in terms of % risked per trade, on the drawdown you are likely to experience during future trading. Notice how as you risk more and more of your account per trade, the closer you are to forcing your account to reach $0.00 (or 100% drawdown). Based on the backtested system we trade; our accounts would eventually hit zero when our risk per trade is at approximately 8%. This is because the position size is so large that you would lose your entire account before you reached a profitable period again.
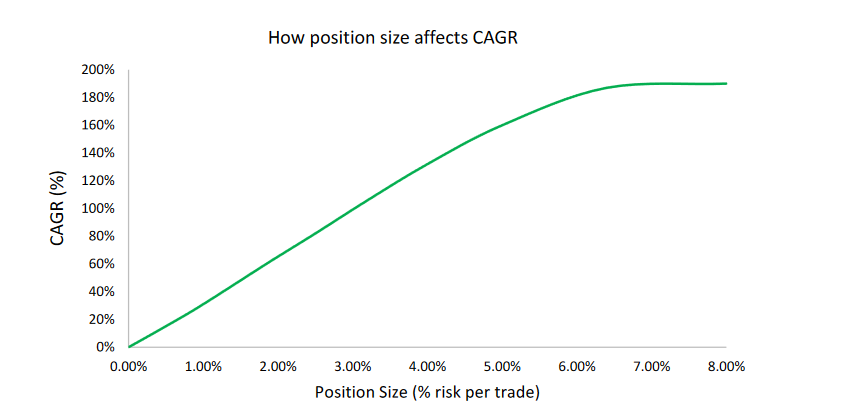
However, increasing the % risked per trade increases the profitability of your trading. The chart below illustrates the compound annual growth rate (CAGR), essentially the average annual percentage return, of the same trading system for various position sizes. For example, choosing a % risked per trade of 5% will provide you with a CAGR of 160%, this kind of return would make you extremely rich.
However, looking back at the first graph above, you can see that a5%risk per trade means you would reach a point where you are likely to lose 80% of the value of your portfolio. In addition, as this data is based on backtesting, which is only a model and does not guarantee future results, there could be a situation in the future where your maximum predicted drawdown is exceeded. As 80% is dangerously close to 100% drawdown, this could mean the end of your account.
This again highlights why choosing your position size is a personal choice. Our trading systems have a position size which provides us with a maximum possible drawdown of 50%. This allows us to gain a good CAGR, whilst minimising the chance our drawdown will reach100%. In addition, from experience, we have found we are able to deal with losing 50% of our accounts and continuing to trade. Many people would not have the discipline to handle a period like this, so be honest when you think about what level of drawdown you are comfortable with.
2.Psychology
Much of this is discussed in our specific trading psychology guides, but essentially this is a trader’s capacity to keep on trading through drawdown periods. You may think you are happy with a 70% drawdown, but ask yourself if you could keep on trading if your account reached $100,000 and then subsequently fell back to $30,000.
3.Market Diversity
This is the principle of distributing your money across a range of unrelated markets; essentially don’t put all your eggs in one basket. One simple method to achieve diversity is by choosing unrelated foreign exchange pairs. For example, choosing AUDUSD and CHFJPY.
The table below shows the dependencies of a few currency pairs. Where a correlation factor of 1 means the currency pair moves in completely the same direction, a factor of 0 means there is no correlation between the currencies and a factor of -1 means the currencies move in exactly the opposite direction.
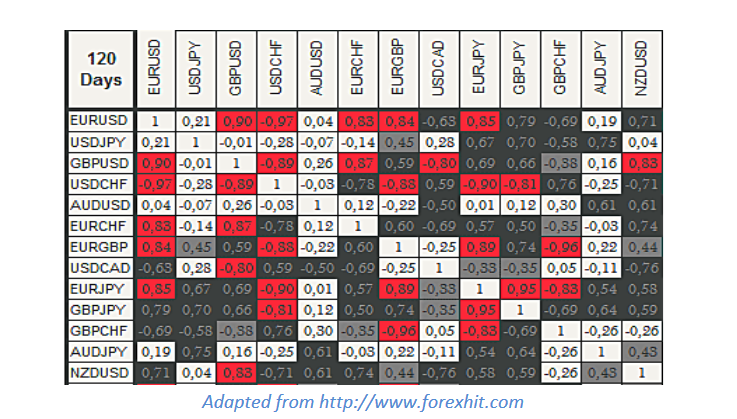
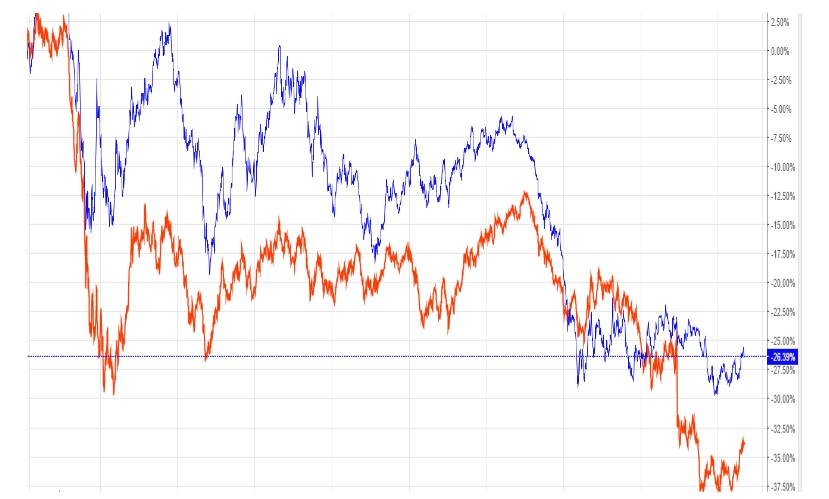
You can see this clearly on the charts. Let’s take GBPUSD and EURUSD as an example from the table above and check the dependence on the charts. You can see from the chart below that it is common for these two currency pairs to follow each other’s movements, they correlate with one another, therefore the correlation factor is 0.90 as explained in the table above. This is good when both currency pairs are trending as you will be making a trading profit in both markets from your trend following strategy. However, when both markets are consolidating, it will be as if you are losing twice in the same market as the correlation between these pairs is so high.
To counteract this phenomenon choosing a variety of currency pairs and commodities is necessary to promote market diversity. A variety of markets with correlation factors from 1 to -1, not just currencies with all 0’s, 1’s or -1’s. Have a few, but not too many, markets with factors close to 1’s or -1’s is absolutely fine as this adds profitability, assuming your risk to reward is above 1:1 (explained later), to your system when a certain currency is trending.
Another method of creating system diversity is to choose different classifications of markets, not just foreign exchange markets. There are two primary market types which you should look to incorporate into your portfolio.
A. Fundamental Driven Markets: These are foreign exchange markets where trading is not the predominant reason why the price moves. This main reason price moves is related to larger macro economic forces.
B. Speculator Driven Markets:These are markets related to stocks and commodities in which trading speculation has the overriding effect on price movement.
Because of this, in our trading strategies, which can be found in our systems guides, we invest in both commodities and foreign exchange markets to ensure classification diversity.
One last point to mention is that during system testing it is likely you will find a market which is not profitable over the testing period. So, should you remove or keep this market in your portfolio? Markets change as their underlying fundamentals change and when speculator opinions change. Therefore, in your testing period, this market could be the worst-performing market but in the future, it could become the best traded market in your portfolio. Think of the markets as dynamic, they will change, and the way to remain adapted to this change is through diversification.